Identifying Common Chart Patterns
Introduction
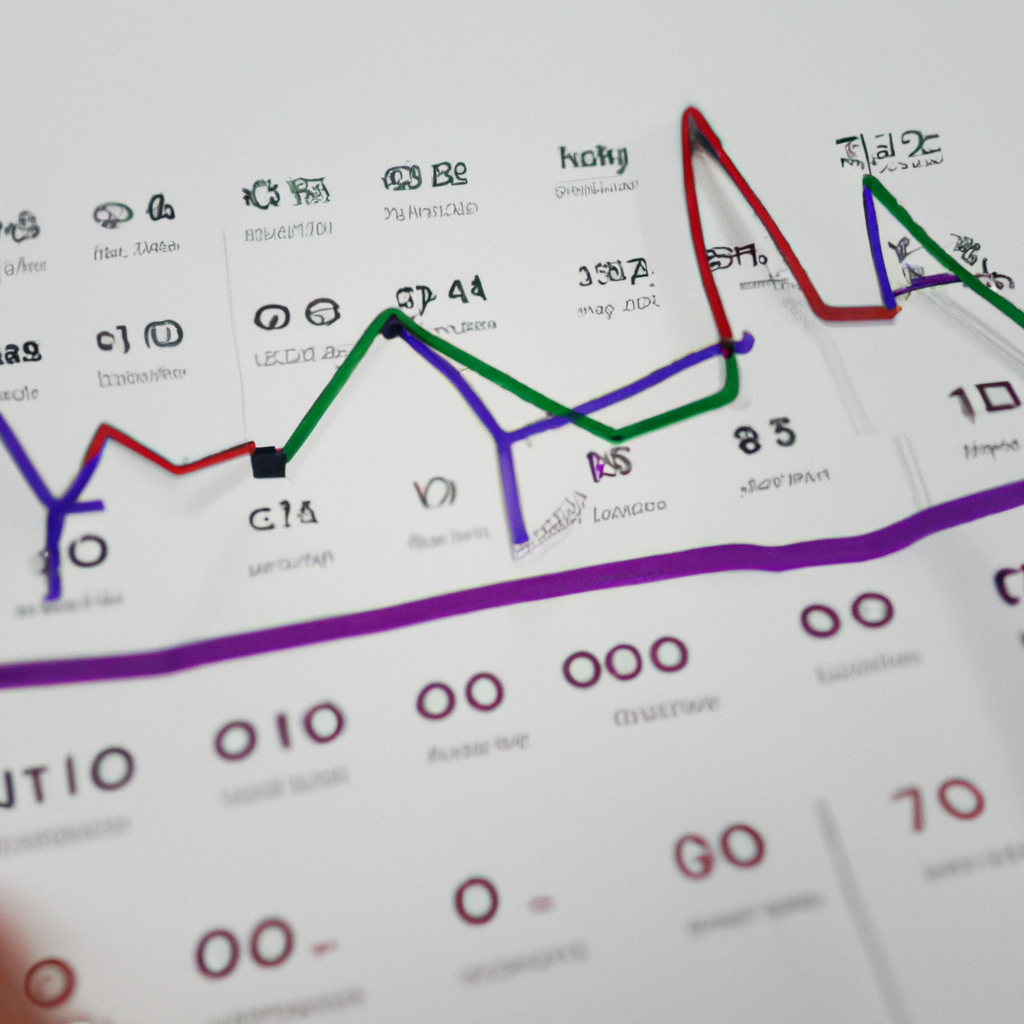
Chart patterns are formations that appear on price charts that can help traders predict future price movements. By recognizing these patterns, traders can make more informed decisions about when to buy or sell assets. In this article, we will discuss some of the most common chart patterns and how to identify them.
Head and Shoulders
One of the most well-known chart patterns is the head and shoulders pattern. This pattern consists of three peaks – the first and third peaks are approximately the same height, while the middle peak (the head) is higher. The neckline is a line drawn connecting the lows between the peaks. When the price breaks below the neckline, it is considered a bearish signal.
Double Top/Bottom
The double top pattern occurs when the price reaches a high, retraces, then reaches a similar high before reversing downwards. Conversely, the double bottom pattern occurs when the price reaches a low, bounces up, then reaches a similar low before reversing upwards. These patterns indicate a potential reversal in the trend.
Triangles
Triangles are chart patterns that form when the price consolidates within converging trendlines. There are three main types of triangles – symmetrical, ascending, and descending. Symmetrical triangles indicate indecision in the market, while ascending triangles suggest bullish momentum and descending triangles suggest bearish momentum.
Cup and Handle
The cup and handle pattern is a bullish continuation pattern that resembles a cup with a handle. The cup forms as the price reaches a high and then retraces, forming a rounded bottom. The handle is a smaller consolidation pattern that forms before the price breaks out to new highs.
Conclusion
By learning to identify common chart patterns, traders can gain valuable insights into potential price movements. While chart patterns are not foolproof indicators, they can provide valuable information that can help traders make more informed decisions. It is important to combine chart patterns with other technical analysis tools to confirm signals and increase the likelihood of successful trades.