Understanding Support and Resistance Levels
Support and resistance levels are key concepts in technical analysis used by traders to identify potential price levels where a stock or security may reverse direction. These levels are based on the idea that the market tends to remember previous price levels and react to them in the future. Understanding how to identify and interpret support and resistance levels can help traders make more informed decisions when buying or selling securities.
Support Levels
Support levels are price levels where a security has historically had difficulty falling below. These levels are seen as a floor for the price of a security, as there is typically a higher level of demand for the security at these levels. When a security reaches a support level, traders may expect the price to bounce back up as buyers step in to support the security.
Support levels can be identified by looking at historical price data and identifying levels where the price has bounced off multiple times in the past. These levels can also be identified using technical analysis tools such as moving averages, trendlines, and Fibonacci retracement levels.
Resistance Levels
Resistance levels are price levels where a security has historically had difficulty breaking above. These levels are seen as a ceiling for the price of a security, as there is typically a higher level of supply for the security at these levels. When a security reaches a resistance level, traders may expect the price to pull back as sellers step in to take profits.
Resistance levels can be identified by looking at historical price data and identifying levels where the price has been unable to break through multiple times in the past. These levels can also be identified using technical analysis tools such as moving averages, trendlines, and Fibonacci retracement levels.
Using Support and Resistance Levels in Trading
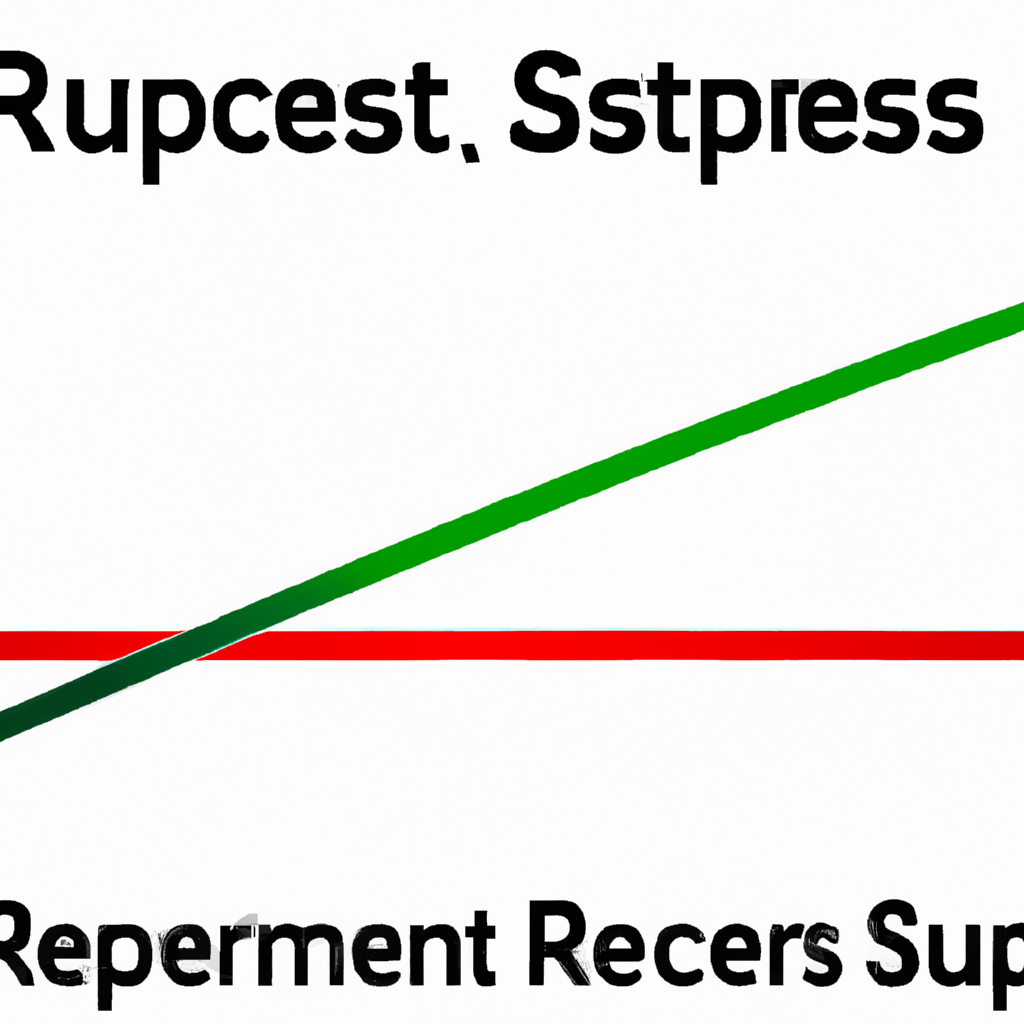
Traders can use support and resistance levels to make more informed trading decisions. When a security approaches a support level, traders may look to buy the security with the expectation that the price will bounce back up. Conversely, when a security approaches a resistance level, traders may look to sell the security with the expectation that the price will pull back.
It is important to note that support and resistance levels are not exact price points, but rather zones where the price of a security is likely to react. Traders should use other technical analysis tools and indicators to confirm their trading decisions and manage risk.
By understanding and using support and resistance levels in their trading strategies, traders can increase their chances of success in the market and make more informed decisions when buying and selling securities.