Introduction
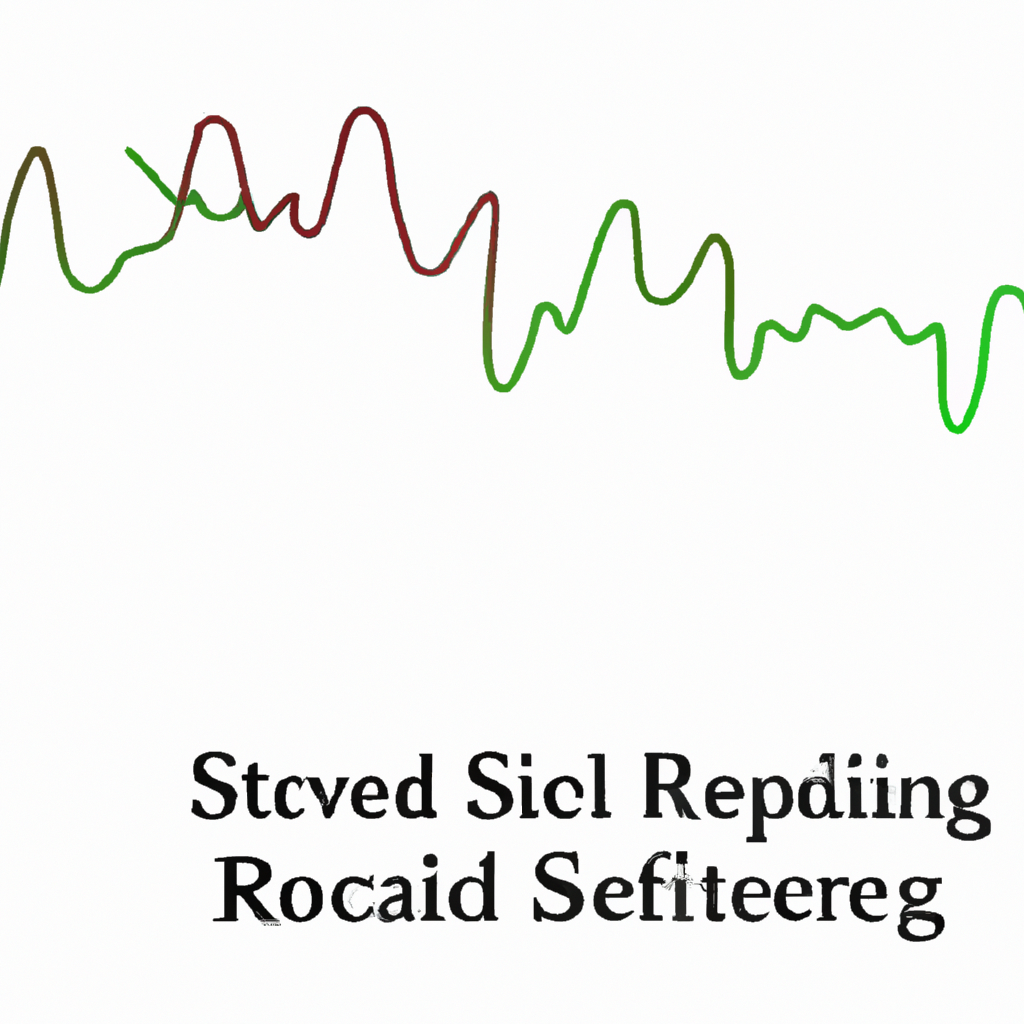
Relative Strength Index (RSI) is a popular technical indicator used by traders to identify overbought or oversold conditions in the market. The RSI oscillator ranges from 0 to 100 and is typically used to generate buy or sell signals based on the strength of price movements. In this article, we will discuss some RSI oscillator strategies that traders can use to improve their trading decisions.
RSI Divergence Strategy
Step 1: Identify RSI Divergence
RSI divergence occurs when the price of an asset is moving in the opposite direction of the RSI oscillator. This can be a sign of a potential trend reversal. Look for instances where the price is making higher highs while the RSI is making lower highs (bearish divergence) or the price is making lower lows while the RSI is making higher lows (bullish divergence).
Step 2: Confirm with Price Action
Before entering a trade based on RSI divergence, it’s important to confirm the signal with price action. Look for other technical indicators or chart patterns that support the potential reversal. This will help reduce false signals and improve the accuracy of your trades.
RSI Overbought/Oversold Strategy
Step 1: Identify Overbought/Oversold Conditions
RSI is typically considered overbought when it is above 70 and oversold when it is below 30. Traders can use these levels to generate buy or sell signals. When RSI is above 70, it may indicate that the asset is overbought and due for a pullback. When RSI is below 30, it may indicate that the asset is oversold and due for a bounce.
Step 2: Wait for Confirmation
While overbought/oversold conditions can be useful for generating trading signals, it’s important to wait for confirmation before entering a trade. Look for other technical indicators or price action signals that support the RSI signal to increase the likelihood of a successful trade.
RSI Trend Reversal Strategy
Step 1: Identify RSI Trend Reversal
RSI can also be used to identify potential trend reversals in the market. Look for instances where RSI crosses above or below the 50 level. A move above 50 may indicate a shift from a downtrend to an uptrend, while a move below 50 may indicate a shift from an uptrend to a downtrend.
Step 2: Confirm with Price Action
As with other RSI strategies, it’s important to confirm trend reversal signals with price action. Look for other technical indicators or chart patterns that support the RSI signal to increase the likelihood of a successful trade.
Conclusion
RSI oscillator strategies can be a valuable tool for traders looking to improve their trading decisions. By using RSI divergence, overbought/oversold conditions, and trend reversal signals, traders can generate more accurate trading signals and increase their chances of success in the market. Remember to always confirm RSI signals with other technical indicators or price action to reduce the risk of false signals.