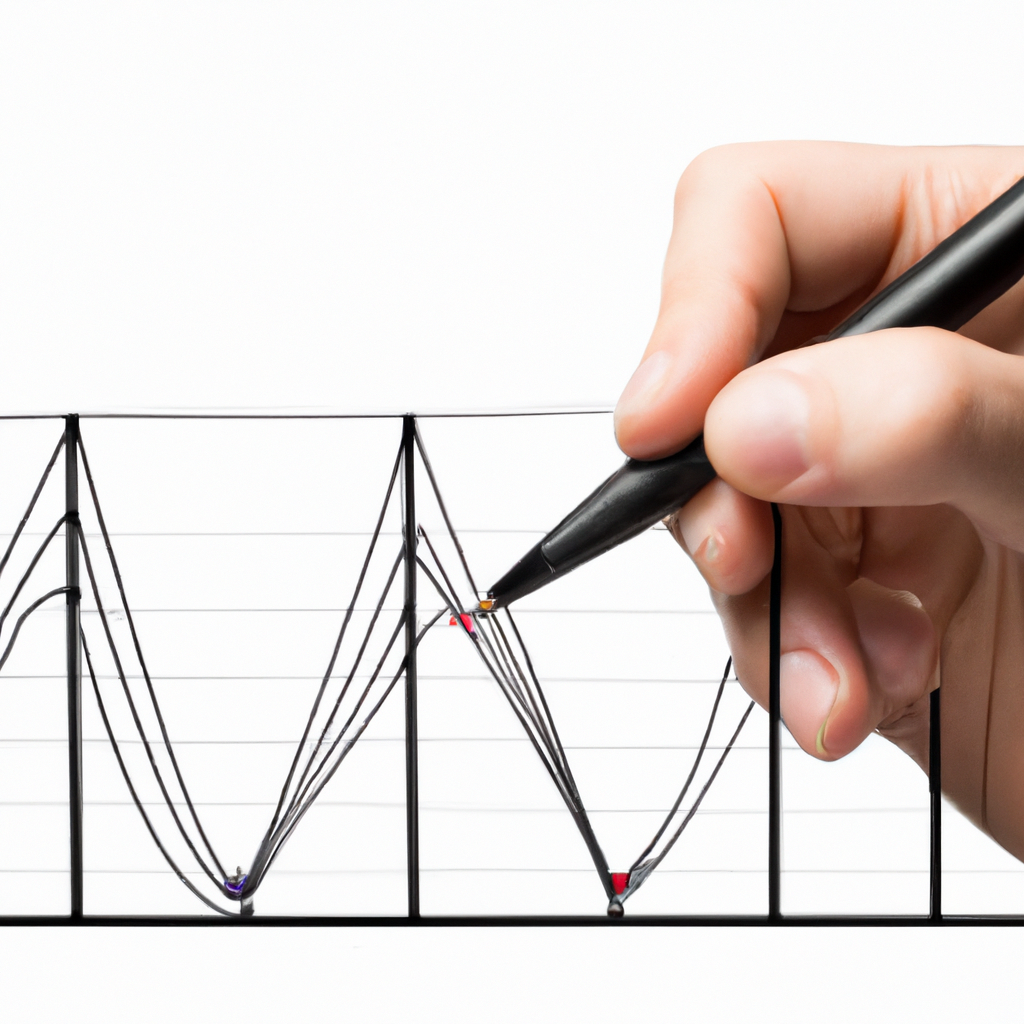
How to Draw Accurate Trend Lines
Understanding Trend Lines
Trend lines are used in technical analysis to help traders and investors identify the direction of a stock or market’s price movement. They are drawn by connecting a series of highs or lows on a chart to create a line that shows the overall trend of the price movement.
Choosing the Right Timeframe
Before drawing a trend line, it’s important to choose the right timeframe for analysis. Different timeframes can result in different trend lines, so it’s important to consider whether you are looking at short-term, medium-term, or long-term trends.
Identifying Key Points
When drawing a trend line, it’s important to identify key points on the chart where the price has either reached a high or a low. These points will be used to connect the trend line and determine the overall trend direction.
Drawing the Trend Line
To draw a trend line, simply connect the key points on the chart using a straight line. If you are drawing an uptrend line, connect the lows on the chart. If you are drawing a downtrend line, connect the highs on the chart.
Confirming the Trend Line
Once you have drawn the trend line, it’s important to confirm that it accurately represents the trend of the price movement. Look for at least three points on the chart that touch or intersect the trend line to confirm its accuracy.
Adjusting the Trend Line
If the trend line does not accurately represent the price movement, it may need to be adjusted. You can adjust the trend line by moving it slightly to better align with the key points on the chart.
Using Trend Lines in Trading
Once you have drawn an accurate trend line, you can use it to make trading decisions. Traders often use trend lines to identify potential entry and exit points, as well as to set stop-loss orders to manage risk.
By following these steps and guidelines, you can draw accurate trend lines to help you analyze price movements and make informed trading decisions.


